Complex Lipids Targeted Panel
Specificity of 1,100 Lipid Species
Accurate Quantitation of 14 Lipid Classes
Complete Coverage of Fatty Acid Composition
Pathway Mapping & Discovery Tools For Easy Interpretation
Product Overview
The Complex Lipids Targeted Panel is the only lipidomics solution able to provide both quantitative compositional analysis and complete speciation data.
A New Kind of Lipidomics
- Identify up to 1,100 molecular species of lipids
- Accurate quantitation of lipid class & molecular species concentrations
- Complete fatty acid composition of each lipid class
- Pathway Mapping and Discovery Tools for easy interpretation
Unlocking Lipid Biology With a Complete Lipidomic Solution
Complex lipids are a diverse class of metabolites that serve many functions in biology and play an important role in the development of metabolic diseases, cancer, inflammation, and central nervous system disorders.
Accurate measures of lipids are essential for biomarker discovery and for clarifying biological questions. But, because they have a diverse array of chemical structures and a high degree of isomeric overlap, lipids are exceptionally challenging to accurately identify and quantify. The obstacles inherent in lipid profiling make high-quality lipidomic platforms extremely rare.
Analyte Coverage
The Complex Lipids Targeted Panel provides the lipid concentration (e.g. TAG), fatty acid composition, and molecular species (e.g. PC(16:0/22:6)) of each of the 14 covered lipid classes.
- Ceramide (CER) – 12 species
- Cholesteryl Esters (CE) – 26 species
- Diacylglycerols (DAG) – 58 species
- Dihydroceramide (DCER) – 12 species
- Hexosylceramide (HCER) – 12 species
- Lactosylceramide (LCER) – 12 species
- Lysophosphatidylcholine (LPC) – 26 species
- Lysophosphatidylethanolamine (LPE) – 26 species
- Monoacylglycerol (MAG) – 26 species
- Phosphatidylcholine (PC) – 140 species
- Phosphatidylethanolamine (PE) – 216 species
- Phosphatidylinositol (PI) – 28 species
- Sphingomyelin (SM) – 12 species
- Triacylglycerols (TAG) – 519 species
Lipidomics Methods Eliminate Quantitative Bias
Lipids are extracted from samples in the presence of internal standards. The extracts are concentrated under nitrogen and reconstituted in dichloromethane:methanol (1:1) with 10 mM ammonium acetate.
The extracts are transferred to inserts and placed in vials for infusion-MS analysis, performed on a Shimadzu LC with nano PEEK tubing and the Sciex SelexION-5500 QTRAP. The samples are analyzed via both positive and negative mode electrospray. The 5500 QTRAP scan is performed in MRM mode with a total of more than 1,100 MRMs.
Individual lipid species are quantified by taking the intensity ratios of target compounds and their assigned internal standards, then multiplying by the concentration of internal standards added to the sample. Lipid class concentrations are calculated from the sum of all molecular species within a class, and fatty acid compositions are determined by calculating the proportion of each class comprised by individual fatty acids.
Surveyor
Our Custom Tools Transform Data Into Knowledge
 In addition to a quantitative results table, the Complex Lipids Targeted Panel also comes with access to Surveyor, a suite of custom-designed data visualization and analysis software tools. Two primary tools exist within Surveyor for interpreting the data—Pathway Mapping Tools and Discovery Tools.
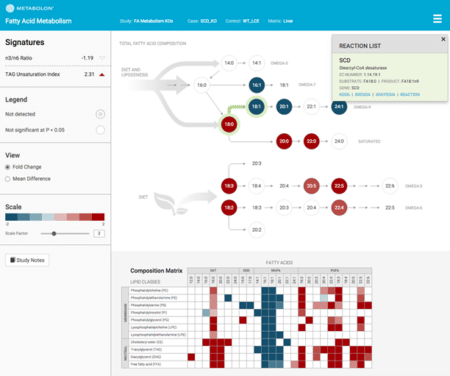
Pathway Mapping Tools
The Surveyor pathway maps allow clients to understand their lipidomic data in the context of lipid metabolic pathways.
Each pathway has been curated and annotated by Metabolon experts, and each element of the map is interactive, providing both data analysis (boxplots and difference testing) and additional information on each metabolite or activity.
Using Pathway Mapping tools, researchers can investigate the effect of their comparisons on the concentration and fatty acid composition of different pathways, including:
- Complex Lipid Metabolism (phospholipids and neutral lipids)
- Sphingolipid Metabolism (ceramides and sphingomyelin)
- Fatty Acid Metabolism
Discovery Tools
Discovery tools allow clients to perform an unbiased evaluation of the performance of each lipid, and layer in biological information and structure when desired. The tools plot all of the measured lipids and allow clients to filter and sort results to aid in the identification of biomarkers.
The Biomarker Performance page provides a comprehensive view of the performance of each lipid marker in separating the treatment groups.
The Time Course/Multiple Comparisons page improves the analysis of time-course and multiple-treatment comparison studies by allowing clients to plot multiple comparisons between groups simultaneously.
In both tools, each plot point is interactive, linking a selected lipid marker to additional information about their structure and biology, including related box plots.